
Clear definitions
Fees, revenue, supply and purchases are different measures. Their labels and units stay explicit.
 Independent Hyperliquid research
See the market. Follow the capital. Connect the data
to the system beneath it.
Independent research built around public observations. Explore the detail, understand the scope, and keep the original source in view.
Read price, funding and positioning together. Find the detail behind a market move.
Trace revenue, supply and Assistance Fund activity through their original sources.
Connect applications, liquidity and network activity across the wider ecosystem.
Explore public positions, follow saved wallets and compare participant activity.
HYPE perpetual mark · USDC
Native perpetual volume · 24h USDC
Native perpetual open interest · USDC
Connecting to source · received —
Three starting points for a deeper understanding of the market and the network behind it.

See the relationship between price, positioning and liquidity.
01 / LIQUID DATA
Read revenue, supply and Assistance Fund purchases in context.
02 / LIQUID DATA
Explore the applications and participants across the network.
03 / LIQUID DATAMove from an observation to its history, its methodology and the related research. Keep the context as you explore.
Read activity and positioning at a glance. Open the source controls to inspect the exact observations behind each chart.
24h total · chart shows the top eight markets
Awaiting market observations
Current total · chart shows the top eight markets
A consistent way to read complex data, from the first observation to the source behind it.
Fees, revenue, supply and purchases are different measures. Their labels and units stay explicit.
Timeframes, receipt times and source coverage accompany the observations they describe.
Move between the overview, specialist tools and explanations without losing the question you started with.
Compare price, funding, open interest and visible liquidity. Move from a network-wide view into the detail of an individual market.
Explore marketsPRICE / POSITIONING / LIQUIDITY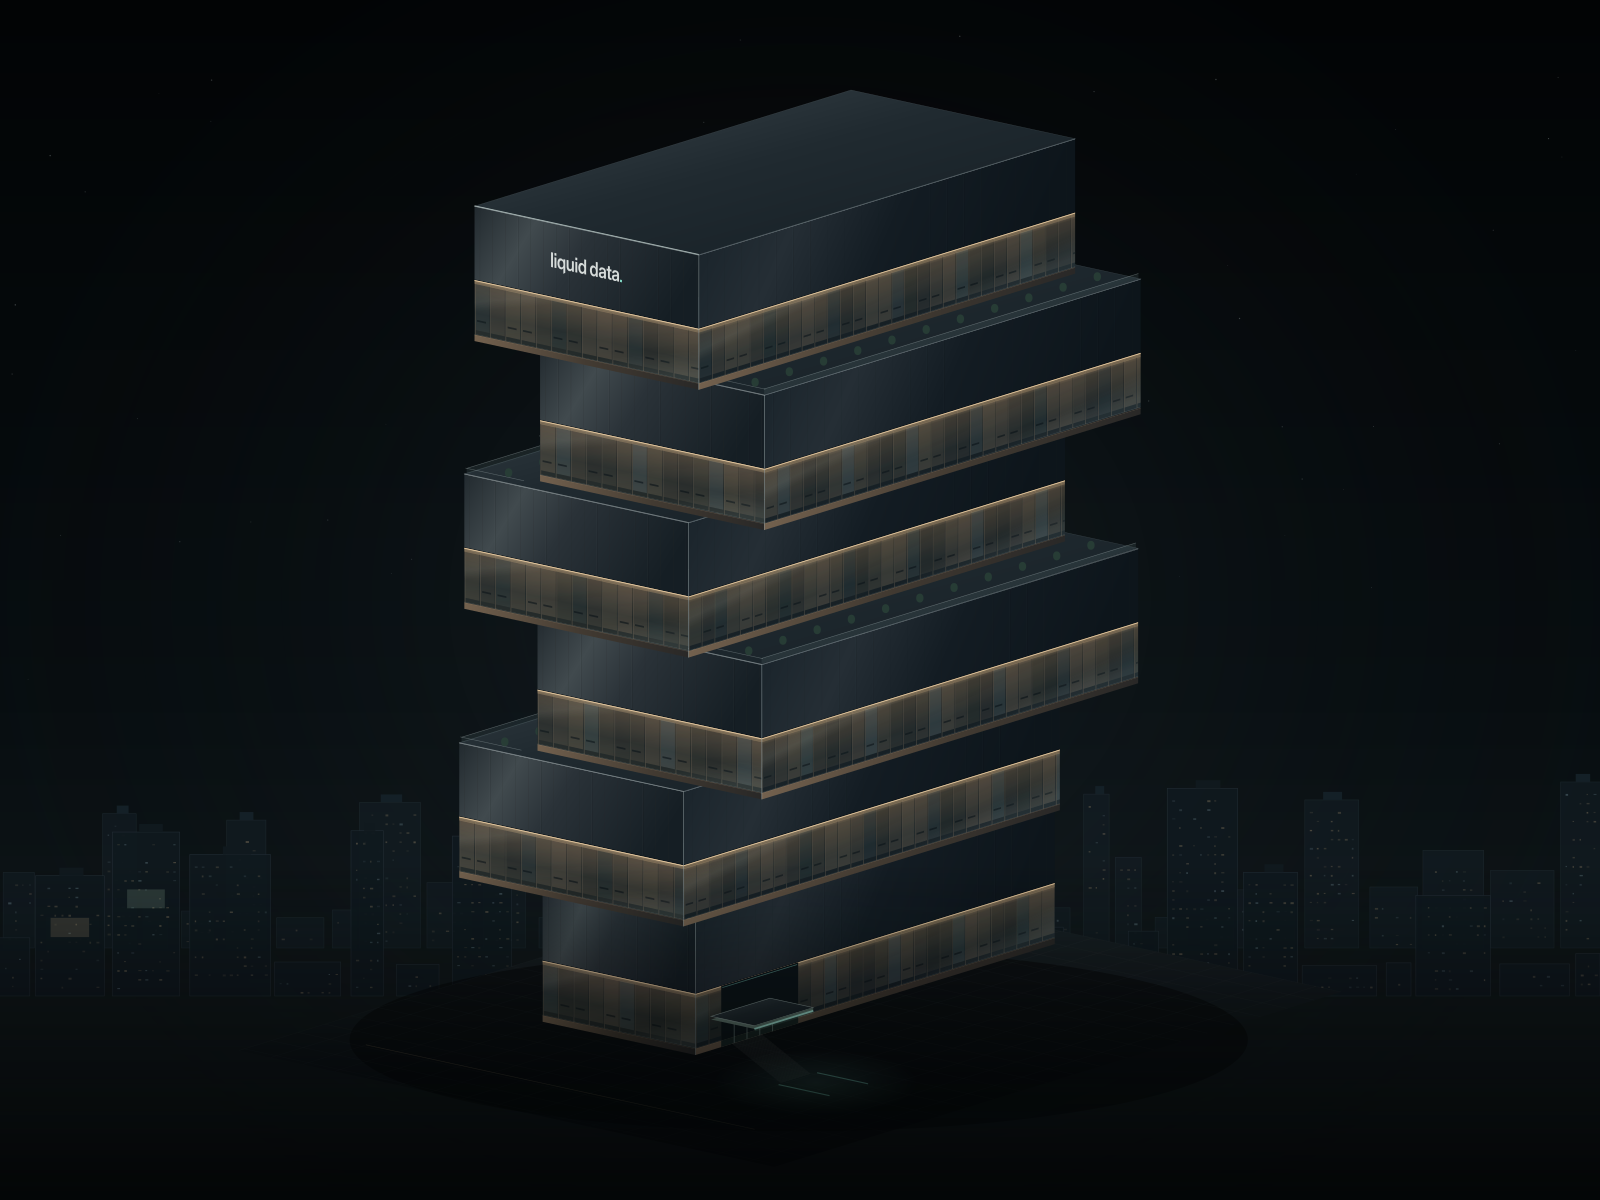
Step into the interactive house. Explore the rooms,
discover the research and follow the connections.
Build a clearer understanding of the concepts behind the data, then explore them in practice.

Explore the concepts, definitions and sources that make the data easier to read.


Find the explanations and the related tools in one place.
Research & learnHow to read the research, understand the sources and find your way around.
Our methodologyLiquid Data is an independent research interface for Hyperliquid. It connects public market observations, protocol economics, ecosystem activity and educational resources.
Open the network overview for a broad view, or choose Markets, Financials, Ecosystem or Wallets from the navigation. Each workspace links to its related research tools.
No. Liquid Data is independent. Source labels identify where each observation comes from.
Loading headlines…
Explore the observations. Understand the context.
Follow the evidence.
Waiting for streaming market data.
Perpetual contexts and available spot reference prices stream. Individual figures retain their own receipt times. Protocol cards refresh public sources independently; historical charts and issuer reports keep their reporting dates.